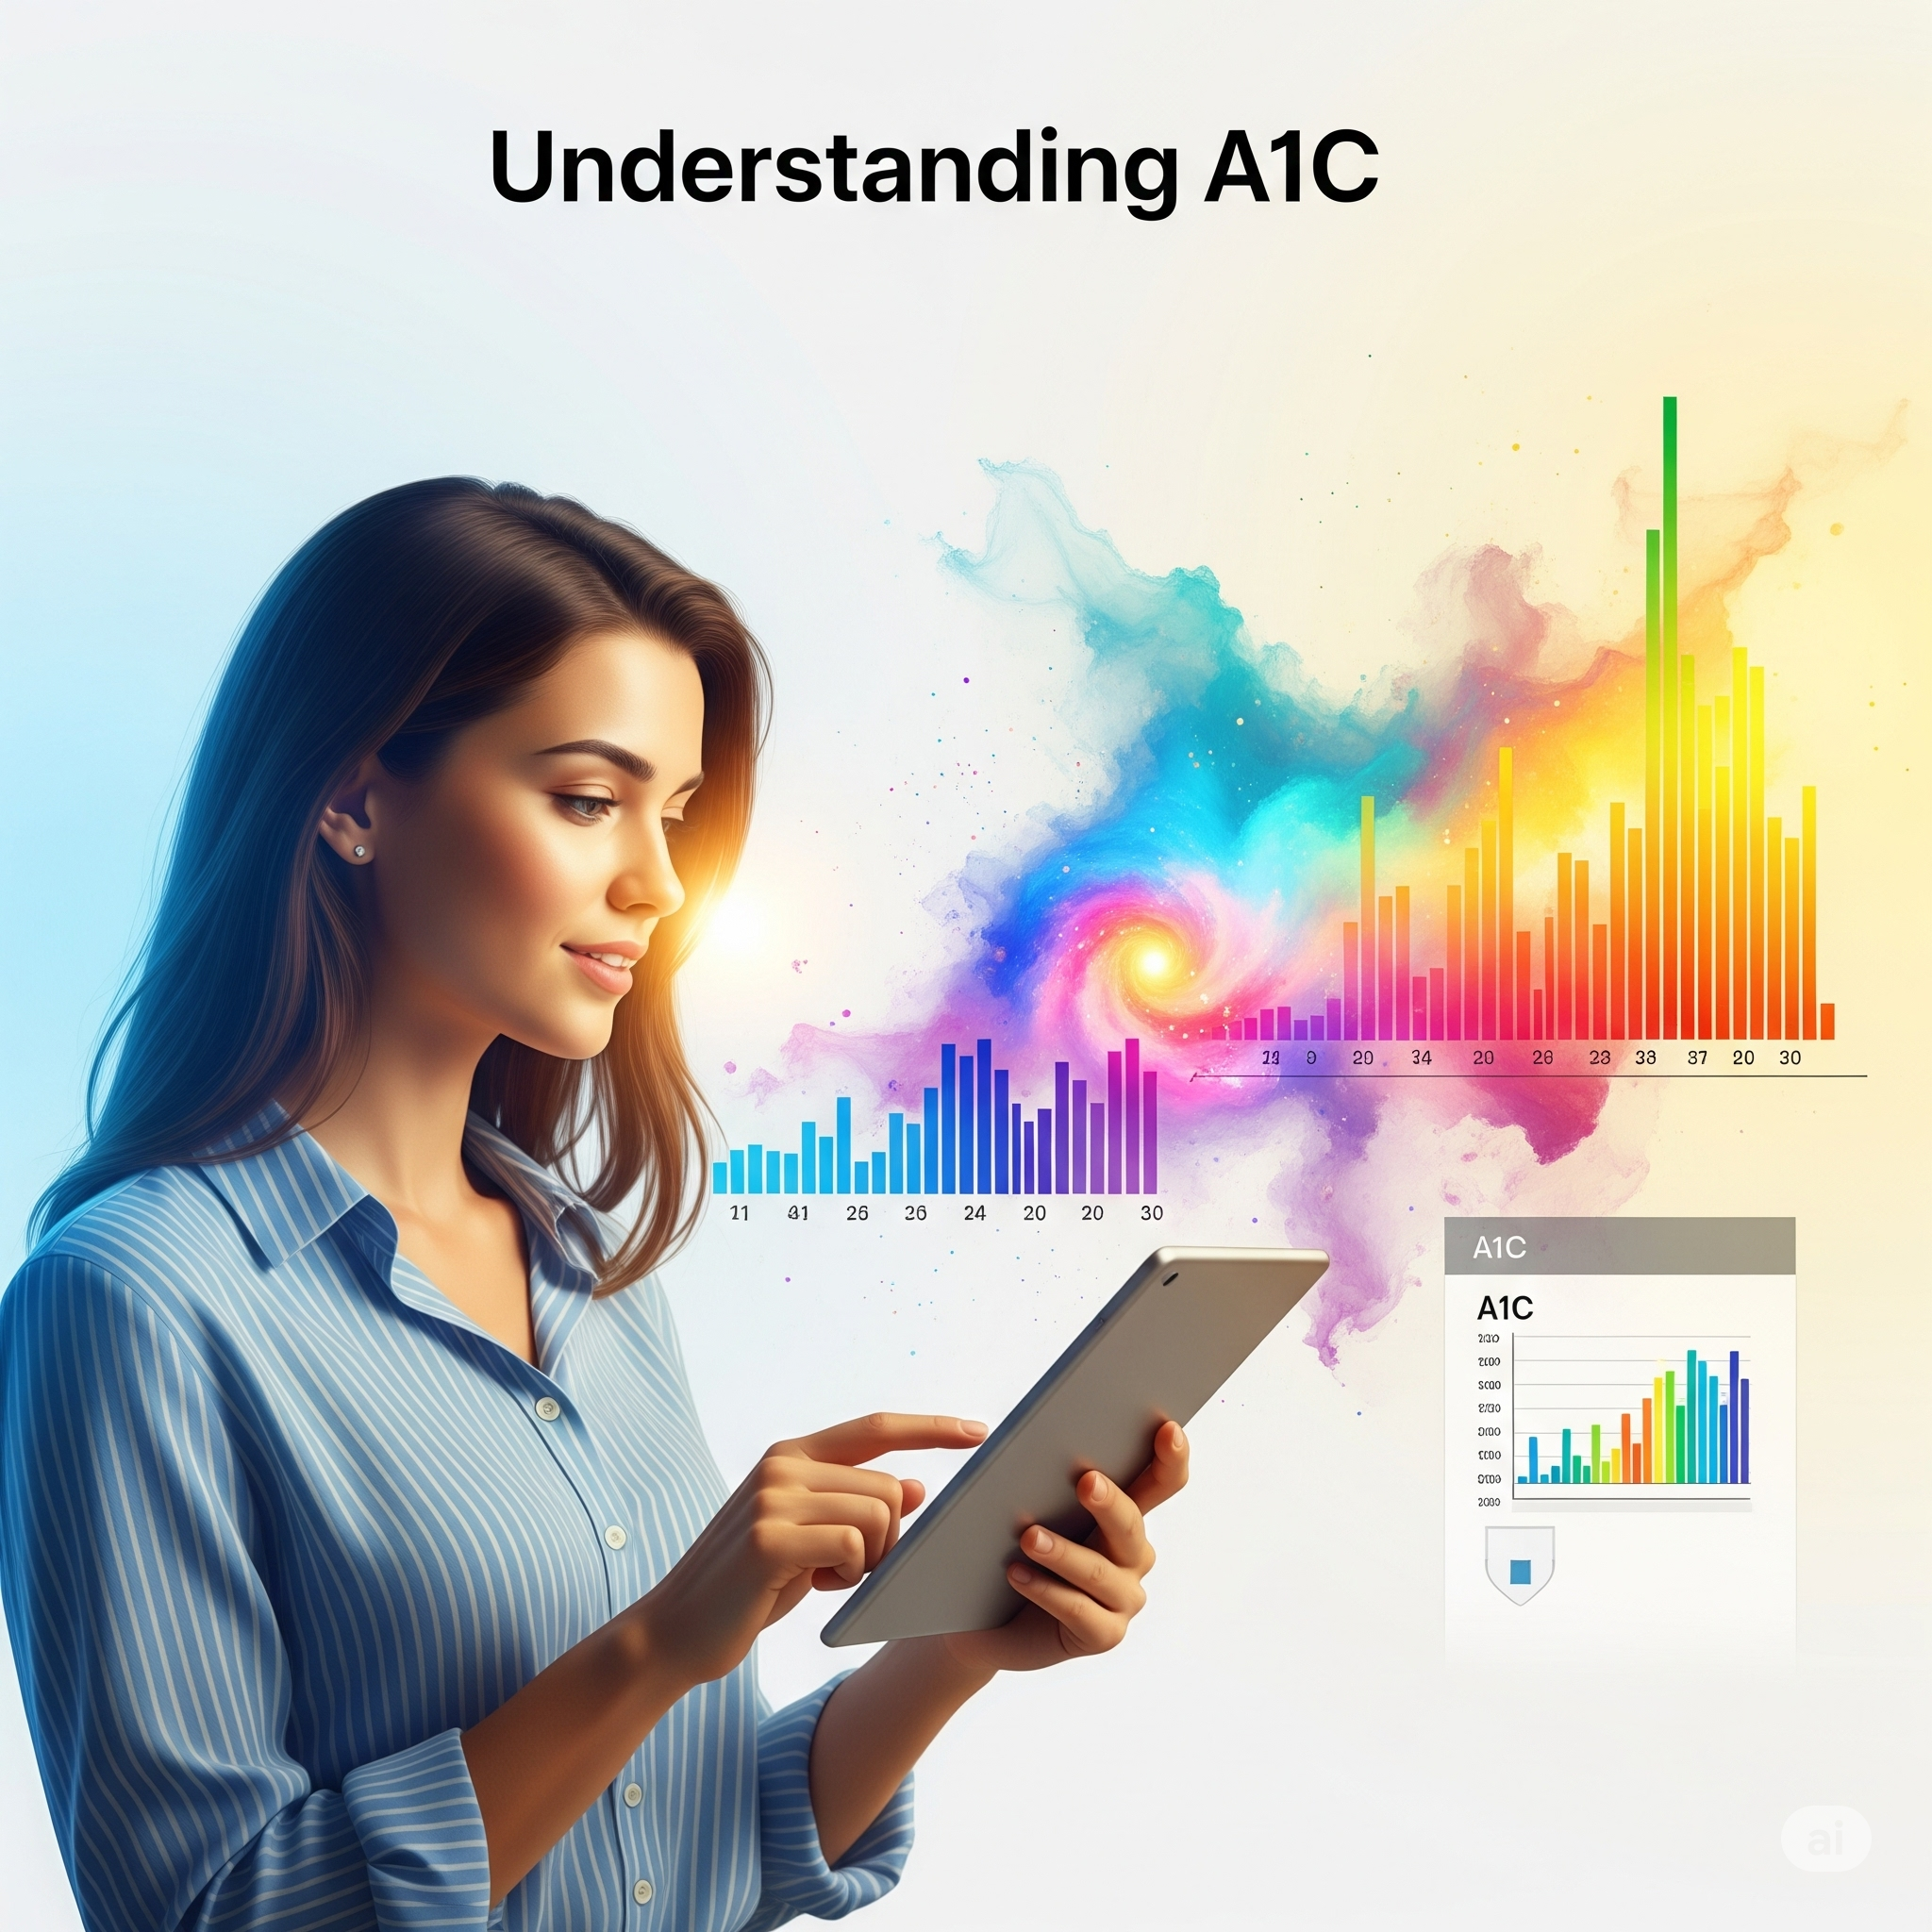
If you’re living with diabetes, you’ve probably heard about your A1C — but what does it actually tell you?
A1C is a blood test that shows your average blood sugar levels over the past 2–3 months. It gives you (and your care team) a big-picture view of how well your blood sugar is being managed — not just the daily ups and downs. It measures how much sugar is attached to your red blood cells. Since you are always making new red blood cells, your A1C changes over time as your blood sugar levels change.
Here’s how A1C levels break down:
✅ Below 5.7% = Normal
⚠️ 5.7% – 6.4% = Prediabetes
🚨 6.5% or higher = Diabetes diagnosis
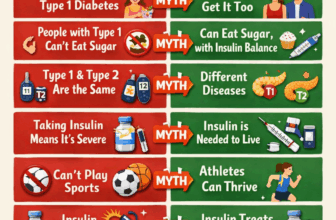
If you live with Type 1 diabetes, you’ve probably heard about your A1C — but what does it really mean for YOU?
What do the numbers mean?
➡️ An A1C of 7% ≈ average blood sugar of 154 mg/dL
➡️ Lower isn’t always better — below 6.5% might increase the risk of lows (hypoglycemia)
➡️ Your target A1C should be personalized — often around 7% for most people with T1D, but it depends on your age, lifestyle, and medical history.
A1C & Average Blood Glucose (BG) Chart
Wondering what your A1C means in daily numbers? Here’s the breakdown:
| A1C (%) | Estimated Avg BG (mg/dL) | Estimated Avg BG (mmol/L) |
|---|---|---|
| 5.0% | 97 | 5.4 |
| 5.5% | 111 | 6.2 |
| 6.0% | 126 | 7.0 |
| 6.5% | 140 | 7.8 |
| 7.0% | 154 | 8.6 |
| 7.5% | 169 | 9.4 |
| 8.0% | 183 | 10.2 |
| 8.5% | 197 | 10.9 |
| 9.0% | 212 | 11.8 |
| 9.5% | 226 | 12.6 |
| 10.0% | 240 | 13.3 |
| 11.0% | 269 | 14.9 |
| 12.0% | 298 | 16.5 |
Why it matters:
A lower A1C reduces the risk of long-term complications like nerve damage, eye problems, and kidney disease. But it’s all about balance — not going too low either!
Pro tip: Check your A1C every 3 to stay on track. Here is another link for information about your A1C- visit this page from ADA.
Small changes in daily habits can lead to big changes in your A1C. Check out our nutrition section for great snack and meal ideas that could help you improve your A1C.